
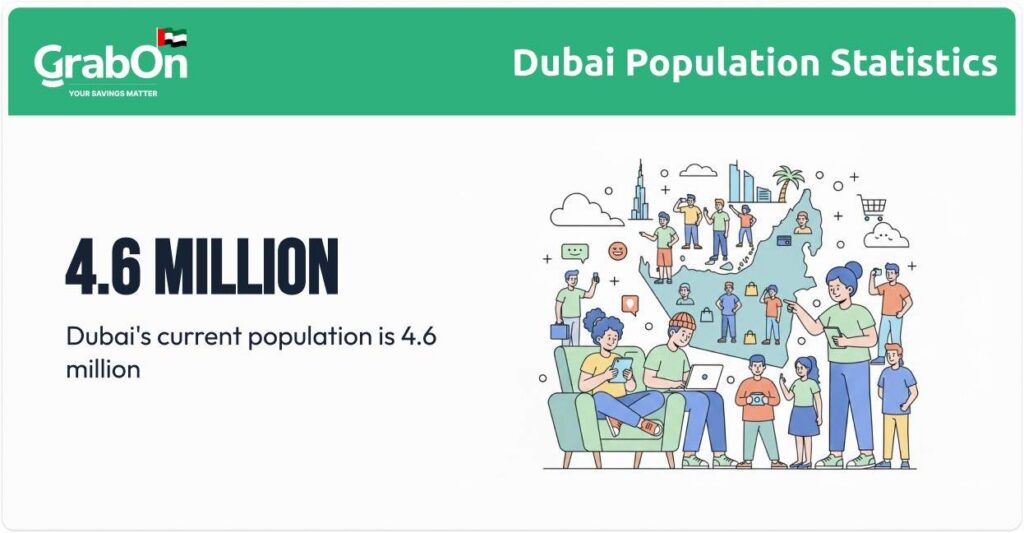
Dubai’s population has grown rapidly over the past few decades, rising from 0.2 million in 1975 to around 4.6 million by January 2026. More than 1.2 million people were added after 2019, showing how strongly the city expanded in the post-pandemic years.
The population is heavily driven by working professionals. Around 73% of residents are between 20 and 49 years old, and men account for nearly 70% of the total population. This structure reflects Dubai’s role as a job-focused, migration-led economy.
This article looks at Dubai’s population trends from 1975 to 2026, covering overall growth, gender and age distribution, sector-wise spread, and how these factors support one of the world’s highest online shopping penetration rates, with 97% of residents shopping online.
Top Picks From The Report
- Dubai’s population stands at 4.6 million as of 2026, up from 3.4 million in 2019.
- Over 73% of Dubai’s residents are between 20 and 49 years old.
- Men make up nearly 70% of Dubai’s total population.
- 97% of Dubai’s population shops online, making it one of the most digitally active markets globally.
Dubai’s Population Over The Years (1975 to 2026)
| Year | Population |
| 1975 | 0.2 million |
| 1980 | 0.3 million |
| 1985 | 0.4 million |
| 1993 | 0.6 million |
| 1995 | 0.7 million |
| 2000 | 0.9 million |
| 2005 | 1.3 million |
| 2006 | 1.4 million |
| 2007 | 1.5 million |
| 2008 | 1.6 million |
| 2009 | 1.8 million |
| 2010 | 1.9 million |
| 2011 | 2.0 million |
| 2012 | 2.2 million |
| 2013 | 2.3 million |
| 2014 | 2.5 million |
| 2015 | 2.6 million |
| 2016 | 2.8 million |
| 2017 | 3.0 million |
| 2018 | 3.2 million |
| 2019 | 3.4 million |
| 2020 | 3.4 million |
| 2021 | 3.5 million |
| 2022 | 3.7 million |
| 2023 | 4.0 million |
| 2024 | 4.2 million |
| 2025 | 4.5 million |
| 2026 (January) | 4.6 million |
As of early 2026, Dubai’s population is estimated at around 4.6 million. This means the city has added more than 1.2 million people since 2019, when the population was close to 3.4 million. The recent growth is much faster than what Dubai saw between 2014 and 2019, showing how strongly the city has grown after the pandemic years.
Looking back, most of this increase happened after 2021. When travel and work returned to normal, people moved to Dubai for jobs, business opportunities, and a better lifestyle. New visa options, such as long-term residence and remote work visas, also made it easier for people to stay longer. Between 2022 and 2024, Dubai added a large number of residents and crossed the 4 million population mark.
Growth was slower in 2020 and 2021 due to COVID-19, when movement was limited and some residents left the city for a short time. A similar slowdown can be seen around 2009, after the global financial crisis. Even during these periods, Dubai’s population did not fall sharply and recovered quickly.
Going further back, the early 2000s were a major growth phase. Large construction projects, new free zones, and rising foreign investment attracted workers and professionals from many countries. During this time, Dubai’s population almost doubled within ten years. Earlier growth, from the late 1970s to the 1990s, was slower and linked mainly to oil income and basic city development.
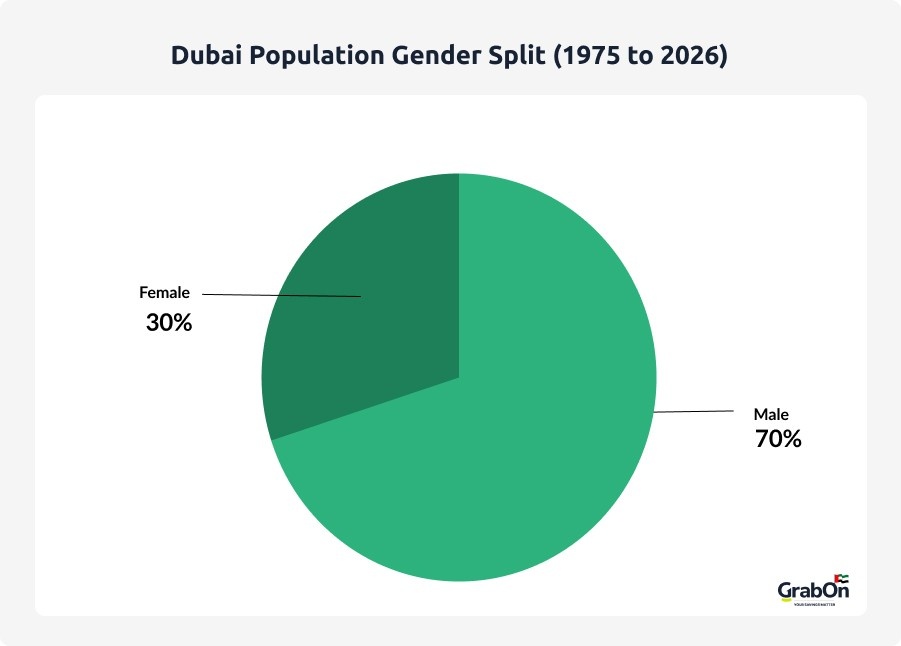
Dubai Population Gender Split (1975 to 2026)
| Year | Males | Females |
| 1975 | 0.1 million | 0.1 million |
| 1980 | 0.2 million | 0.1 million |
| 1985 | 0.2 million | 0.1 million |
| 1993 | 0.4 million | 0.2 million |
| 1995 | 0.5 million | 0.2 million |
| 2000 | 0.6 million | 0.3 million |
| 2005 | 1.0 million | 0.3 million |
| 2006 | 1.1 million | 0.3 million |
| 2007 | 1.2 million | 0.4 million |
| 2008 | 1.3 million | 0.4 million |
| 2009 | 1.4 million | 0.4 million |
| 2010 | 1.5 million | 0.4 million |
| 2011 | 1.5 million | 0.5 million |
| 2012 | 1.6 million | 0.6 million |
| 2013 | 1.6 million | 0.7 million |
| 2014 | 1.7 million | 0.8 million |
| 2015 | 1.8 million | 0.8 million |
| 2016 | 2.0 million | 0.8 million |
| 2017 | 2.1 million | 0.9 million |
| 2018 | 2.2 million | 1.0 million |
| 2019 | 2.3 million | 1.0 million |
| 2020 | 2.4 million | 1.0 million |
| 2021 | 2.4 million | 1.1 million |
| 2022 | 2.6 million | 1.2 million |
| 2023 | 2.7 million | 1.2 million |
| 2024 | 2.9 million | 1.3 million |
| 2025 | 3.1 million | 1.4 million |
| 2026 (January) | 3.1 million | 1.5 million |
As of early 2026, men make up around 70% of Dubai’s population, while women account for the remaining 30%. This gap is mainly due to the large number of male migrant workers who move to the city for jobs.
Looking back, the difference between the male and female populations became more noticeable from the early 2000s. During this period, Dubai saw rapid growth in construction, real estate, transport, and services. Most of the jobs created in these sectors were taken up by men, which pushed the male population much higher than the female population. As a result, the gender gap widened as the total population grew.
From 2014 onwards, the gender ratio became more stable. While the total population continued to increase, the share of men and women remained fairly consistent. This shows that Dubai’s growth during recent years has been balanced across different job sectors, including business, tourism, retail, and professional services, which attract both men and women.
During the COVID-19 years (2020–2021), the gender split did not change much, even though overall population growth slowed. After 2021, both male and female populations increased again, following the return of migration and economic activity.
Dubai Population By Age
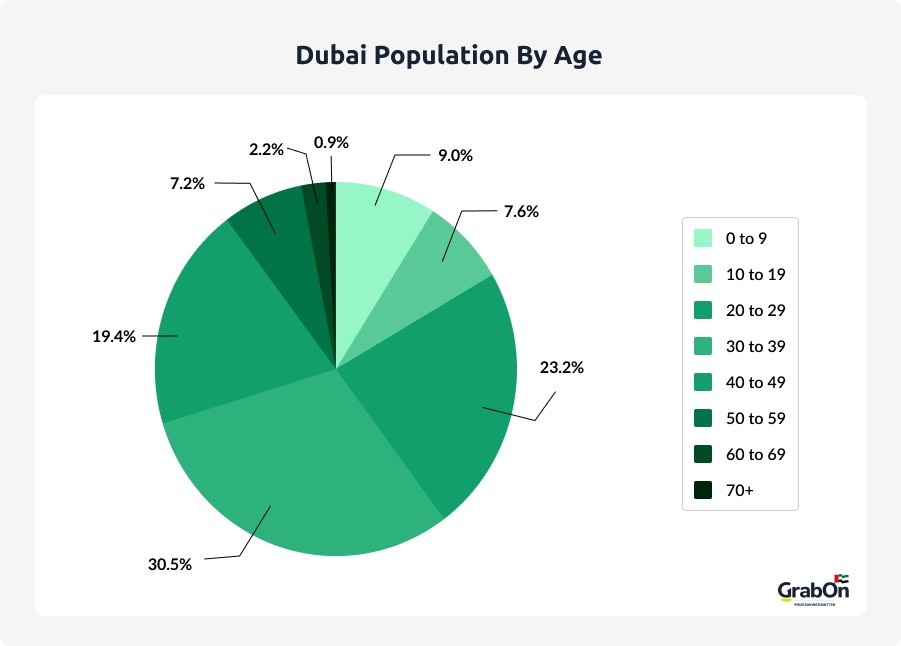
| Age Group | Share of Total Population | Population |
| 0 to 9 | 9.0% | 0.41 million |
| 10 to 19 | 7.6% | 0.35 million |
| 20 to 29 | 23.2% | 1.07 million |
| 30 to 39 | 30.5% | 1.40 million |
| 40 to 49 | 19.4% | 0.89 million |
| 50 to 59 | 7.2% | 0.33 million |
| 60 to 69 | 2.2% | 0.10 million |
| 70+ | 0.9% | 0.04 million |
| Total | 100% | 4.60 million |
As of early 2026, Dubai’s population is strongly concentrated in the working-age brackets, with people between 20 and 49 years accounting for 73.1% of the total population. This reflects the city’s role as a job-driven destination, where most residents move in for employment during their most productive years rather than for long-term settlement.
The shift toward a younger workforce became more visible from the early 2000s, when Dubai expanded rapidly across construction, infrastructure, trade, and services. These sectors attracted large numbers of working professionals and skilled labour, which increased the share of people in their 20s and 30s. Over time, this age structure became a defining feature of the city’s population.
From around 2014 onwards, the age distribution has remained relatively stable. While the total population continued to grow, the dominance of the 20 to 39 and 40 to 49 age groups did not change significantly. This indicates steady inflows of working-age residents across multiple industries, including tourism, retail, logistics, finance, and professional services.
Younger age groups and older residents make up a much smaller share of the population. This suggests that Dubai attracts people mainly during their career-building phase, while fewer residents stay into retirement. Even during the COVID-19 period, the overall age structure did not shift dramatically, and post-2021 growth followed the same pattern, with population increases led primarily by working-age migrants.
Dubai Population Distribution By Sectors
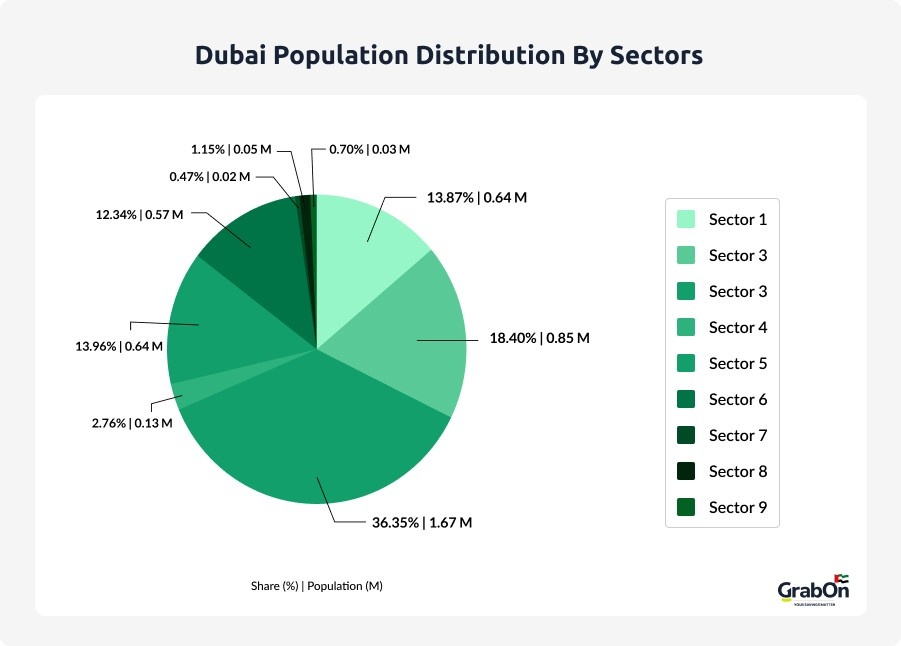
| Sector | Share | Population |
| Sector 1 | 13.87% | 0.64 million |
| Sector 2 | 18.40% | 0.85 million |
| Sector 3 | 36.35% | 1.67 million |
| Sector 4 | 2.76% | 0.13 million |
| Sector 5 | 13.96% | 0.64 million |
| Sector 6 | 12.34% | 0.57 million |
| Sector 7 | 0.47% | 0.02 million |
| Sector 8 | 1.15% | 0.05 million |
| Sector 9 | 0.70% | 0.03 million |
| Total | 100% | 4.60 million |
Filipinos in Dubai Statistics
- Around 450,000 Filipinos live in Dubai, making up roughly 21.3% of the emirate’s total population, the UAE overall hosts around 700,000 Filipinos, making it the second-largest employer of Philippine expats after Saudi Arabia.
- The top sectors employing Filipinos are architecture, engineering & construction (17%), tourism & hospitality (16%), customer service (13%), healthcare (10%), and marketing & advertising (8%). Notably, around 20,000 Filipino nurses work in the UAE, representing 60% of all migrant nurses.
- 64% of Filipino expats hold a university or college degree, with 6.7% having post-graduate qualifications. Over the past five years, 63% saw salary increases, and one in five earns between AED 10,000 to 40,000 per month.
- Filipinos in the UAE remit approximately AED 4.74 billion back to the Philippines, playing a significant role in boosting the country’s GDP.
- Major Filipino community hubs in Dubai include Bur Dubai, Deira, Al Karama, Al Satwa, International City, Al Qusais, Al Nahda, Jumeira, Al Rigga, and Al Quoz.
Online Shopping Demographics of Dubai
97% of Dubai’s population is shopping online as of 2026. That is equivalent to 4.46 million people in the region. supported by near-universal internet and mobile access. Most people use smartphones for shopping, and the majority of online buyers are young and digitally fluent. Dubai’s ecommerce growth is not only local, but a large share of purchases is also cross-border, especially for international brands.
- Nearly the entire adult population in Dubai is digitally reachable, which directly supports one of the highest ecommerce penetration rates globally.
- Over half of Dubai’s population falls in the 20 to 39 age bracket, the most active group for frequent online shopping and app-based purchases.
- The relatively small share of people aged 60+ keeps ecommerce adoption high, as most residents are comfortable with digital payments and mobile apps.

I go the core of any topic and combine the best so that users don’t have to look elsewhere once they are on my blog.