


In 2025, Dubai International Airport handled over 95 million passengers, the highest ever, while hotels pushed room rates above $200 on average in early 2026, showing strong demand across the board.
What makes this more interesting is that this growth is happening despite global uncertainty and shifting travel trends. Visitor numbers are holding steady, hotel revenues are rising, and the city continues to attract travelers from across regions.
Dubai isn’t just growing, it’s doing it consistently, even when the global travel market is unpredictable.
Dubai Tourism Statistics At a Glance
- Dubai received 19.58 million international visitors in 2025, up from 18.71 million in 2024 a 4.6% year-on-year increase.
- In early 2026, January alone recorded 1.99 million visitors, a 2.8% rise.
- Dubai consistently ranks among the top 5 most visited cities globally.
- The occupied room nights in Dubai reached 40.85 million in 2025, up from 39.19 million in 2024.
- Tourism contributes approximately 11 to 12% of Dubai’s GDP.
Number of Tourists in Dubai Over the Years
Dubai welcomed 1,995,000 international stopover visitors in the month of January 2026. We don’t have the official data for 2026 beyond January, but it’s estimated that the number will take a hit from March onwards due to the tension in the Middle East.
Talking about last year, Dubai welcomed 19.58 million international stopover visitors in the complete year 2025, compared to 18.71 million in 2024. This represents a solid 4.6% increase, demonstrating that the city’s appeal continues to grow even as it reaches what many might consider saturation levels.
International Stopover Visitors by Month (2026 Data)
| Month | 2026 | 2025 | 2024 | Percent Change from 2024 to 2025 |
| January | 1,995,000 | 1,940,000 | 1,770,000 | 9.6% |
| February | Data not out yet | 1,880,000 | 1,905,000 | -1.3% |
| March | Data not out yet | 1,490,000 | 1,505,000 | -1.0% |
| April | Data not out yet | 1,840,000 | 1,500,000 | 22.7% |
| May | Data not out yet | 1,530,000 | 1,440,000 | 6.3% |
| June | Data not out yet | 1,200,000 | 1,190,000 | 0.8% |
| July | Data not out yet | 1,290,000 | 1,310,000 | -1.5% |
| August | Data not out yet | 1,370,000 | 1,310,000 | 4.6% |
| September | Data not out yet | 1,410,000 | 1,360,000 | 3.7% |
| October | Data not out yet | 1,750,000 | 1,670,000 | 4.8% |
| November | Data not out yet | 1,848,000 | 1,826,000 | 1.2% |
| December | Data not out yet | 2,040,000 | 1,930,000 | 5.7% |
| YTD | 1,995,000 | 19,588,000 | 18,716,000 | 4.6% |
The monthly trend gives a clearer picture of how tourism performed across 2025. The year started strong, with January bringing in 1.94 million visitors, up 9.6% from the previous year, showing solid demand during Dubai’s peak season.
Not every month saw growth, though. February and March recorded slight declines of 1.3% and 1.0%, but this slowdown didn’t last long. April stood out as the strongest month, jumping 22.7% to 1.84 million visitors, giving a major boost to overall numbers.
Through the summer months, performance stayed relatively stable. May grew by 6.3%, while June remained almost flat at 0.8%. July saw a small dip of 1.5%, which is expected given the extreme heat, but the drop was limited, showing steady demand even in the off-season.
From August onward, momentum picked up again. Visitor numbers grew consistently, with August up 4.6%, September up 3.7%, and October up 4.8%. November saw slower growth at 1.2%, but December closed the year strong with 2.04 million visitors, a 5.7% increase and one of the highest monthly totals of the year.
Overall, Dubai welcomed 19.59 million visitors in 2025, up from 18.72 million in 2024, marking a 4.6% increase. The growth may look moderate compared to earlier rebound years, but it shows a more stable and mature phase, where demand remains strong across seasons rather than relying on sharp spikes.
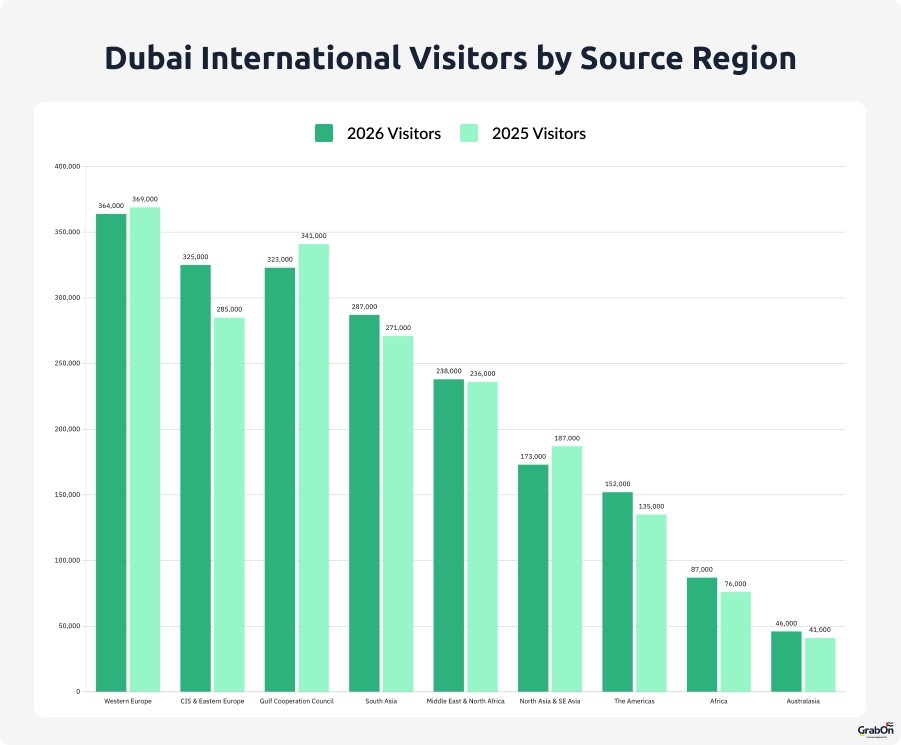
International Visitors by Source Region
| Region | 2026 Visitors | 2026 % Share | 2025 Visitors | 2025 % Share | % Change |
| Western Europe | 364,000 | 18.2% | 369,000 | 19.0% | -1.4% |
| CIS & Eastern Europe | 325,000 | 16.3% | 285,000 | 14.7% | 14.0% |
| Gulf Cooperation Council | 323,000 | 16.2% | 341,000 | 17.6% | -5.3% |
| South Asia | 287,000 | 14.4% | 271,000 | 14.0% | 5.9% |
| Middle East & North Africa | 238,000 | 11.9% | 236,000 | 12.2% | 0.8% |
| North Asia & SE Asia | 173,000 | 8.7% | 187,000 | 9.6% | -7.5% |
| The Americas | 152,000 | 7.6% | 135,000 | 7.0% | 12.6% |
| Africa | 87,000 | 4.4% | 76,000 | 3.9% | 14.5% |
| Australasia | 46,000 | 2.3% | 41,000 | 2.1% | 12.2% |
| Total | 1,995,000 | 100.0% | 1,941,000 | 100.0% | 2.8% |
The Gulf Cooperation Council countries came in second, sending 2.76 million visitors, which represented 15.7% of total arrivals and showed a 10.2% increase. South Asia contributed 2.60 million visitors at 14.8% share, though this actually represented a 9.1% decline from the previous year. The CIS and Eastern Europe region brought 2.58 million visitors with a 9.8% increase, while the Middle East and North Africa region added 1.96 million visitors with a modest 1.1% growth.
The Americas showed particularly strong growth at 10.3%, bringing in 1.23 million visitors, while Australasia demonstrated even more impressive growth at 11.9%, though from a smaller base of 357,000 visitors. Africa was the only region besides South Asia to show a decline, dropping 2.1% to 774,000 visitors. This geographic diversity in visitor sources provides Dubai with a stable foundation, ensuring the city isn’t overly dependent on any single market.
Dubai Tourism Revenue
While visitor numbers tell one part of the story, tourism revenue reveals the true economic impact of these arrivals. The 2025 data through November shows not just more visitors, but visitors who are spending more generously during their stays. The occupied room nights reached 40.85 million in 2025, up from 39.19 million in 2024. This 4.2% increase in room nights closely tracks with the overall visitor growth, suggesting that the average length of stay has remained relatively stable.
Hotel Performance Metrics (YTD January 2026)
| Metric | 2026 | 2025 | % Change |
| Occupied Room Nights | 4,110,000 | 4,010,000 | 2.5% |
| Average Length of Stay | 3.79 | 3.76 | 0.8% |
| Average Daily Rate (USD) | $211.17 | $186.10 | 13.5% |
| RevPAR (USD) | $182.02 | $156.95 | 16.0% |
As of early 2026 (January data), hotel pricing in Dubai had already seen a sharp rise, with the average daily rate reaching $211.17, up from $186.10 in 2025, a strong 13.5% increase that shows clear pricing power.
This trend is reflected in revenue as well, with RevPAR climbing to $182.02 from $156.95, a 16% jump, meaning hotels were earning more from every available room.
The average stay also increased slightly to 3.79 nights from 3.76, which, while small, still contributes to higher overall visitor spending.
Demand remained steady too, with occupied room nights reaching 4.11 million compared to 4.01 million, a 2.5% increase.
Overall, as of early 2026, the market was in a strong position, with hotels successfully increasing rates while maintaining demand and improving revenue, although trends may have shifted due to the war situation in the Gulf, we will update this space as we get our hands on newer data, and things should be clear.
Hotel Inventory and Performance
| Category | 2026 | 2025 | % Change |
| Hotels 5 Star | 174 | 167 | 4.2% |
| Hotels 4 Star | 195 | 197 | -1.0% |
| Hotels 1–3 Star | 278 | 276 | 0.7% |
| Hotels Total | 647 | 640 | 1.1% |
| Category | 2026 | 2025 | % Change |
| Hotels 5 Star | 56,387 | 53,774 | 4.9% |
| Hotels 4 Star | 43,655 | 43,855 | -0.5% |
| Hotels 1–3 Star | 29,492 | 29,276 | 0.7% |
| Hotels Total | 129,534 | 126,905 | 2.1% |
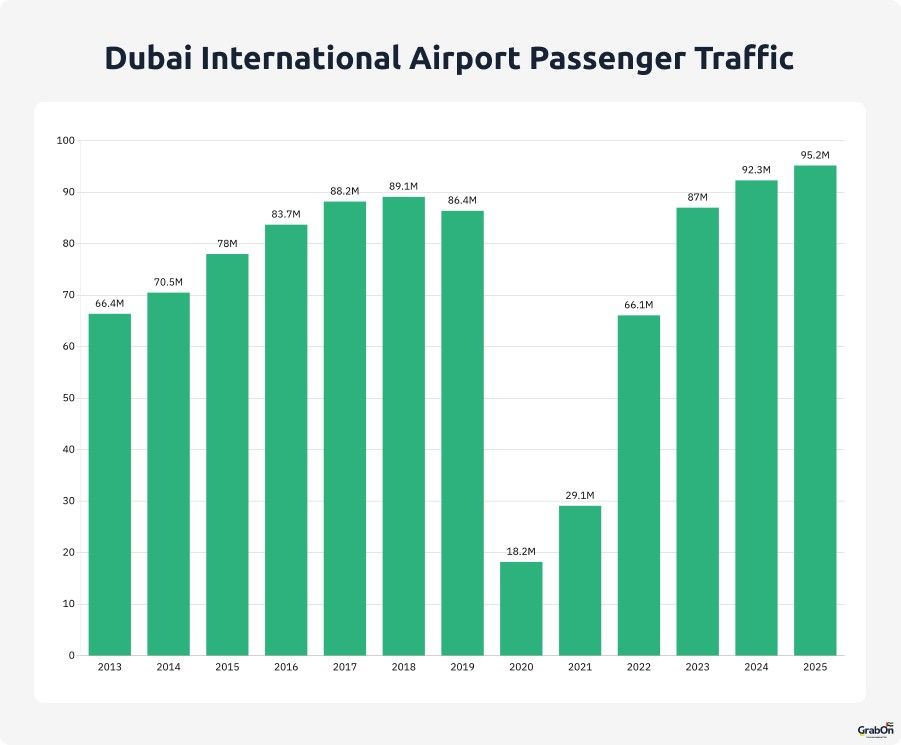
Dubai International Airport Passenger Traffic (2013-2025)
| Year | Passengers | Year-on-Year Change |
| 2013 | 66.4 million | – |
| 2014 | 70.5 million | +6.2% |
| 2015 | 78.0 million | +10.6% |
| 2016 | 83.7 million | +7.3% |
| 2017 | 88.2 million | +5.4% |
| 2018 | 89.1 million | +1.0% |
| 2019 | 86.4 million | -3.0% |
| 2020 | 18.2 million | -78.9% |
| 2021 | 29.1 million | +59.9% |
| 2022 | 66.1 million | +127.1% |
| 2023 | 87.0 million | +31.6% |
| 2024 | 92.3 million | +6.1% |
| 2025 | 95.2 million | +3.14% |
Looking at the long-term trend gives better context to what’s happening now. Back in 2013, Dubai International handled 66.4 million passengers, and traffic grew steadily over the years, reaching 89.1 million in 2018. There was a slight dip in 2019 to 86.4 million, but overall demand remained strong before global travel came to a halt in 2020, when passenger numbers dropped sharply to just 18.2 million.
Recovery started in 2021 with 29.1 million passengers, and by 2022, traffic had already bounced back to 66.1 million, showing that demand was returning faster than expected. The real momentum came in 2023, with passenger numbers reaching 87.0 million, nearly matching pre-pandemic levels.
Dubai then moved beyond recovery mode. In 2024, the airport handled 92.3 million passengers, setting a new record. This growth continued into 2025, reaching 95.2 million passengers, marking another all-time high, though growth has started to stabilize compared to the sharp rebound years.
What stands out is the timing of this growth. Even with ongoing geopolitical tensions, shifting travel patterns, and uncertainty across parts of the Middle East and global markets, Dubai has continued to attract both tourists and transit passengers at scale. While some global hubs are still stabilizing, Dubai has already moved ahead and expanded beyond its previous peak.
A big part of this comes from its position as a global transit hub. Dubai connects major routes between Asia, Europe, and the Americas, and a large share of passengers are in transit. At the same time, strong tourism demand, airline network expansion, and consistent infrastructure investment have helped maintain this growth.
At nearly 100 million passengers, capacity is now a real consideration. Dubai is already planning ahead with Al Maktoum International Airport, which is expected to take on future demand. But for now, Dubai International continues to handle growing volumes efficiently, reinforcing its position as one of the busiest and most important airports in the world.
Frequently Asked Questions About Dubai’s Tourism Industry
- How many tourists visited Dubai in 2025?
Dubai welcomed 19.59 million visitors in 2025, up from 18.72 million in 2024. This marks a 4.6% year-on-year growth, showing steady demand even after the strong post-pandemic rebound. - Which month had the highest tourist arrivals in 2025?
December 2025 recorded the highest numbers, with 2.04 million visitors, followed by January with 1.94 million. These peak months align with Dubai’s winter tourism season. - Is Dubai’s tourism still growing in 2026?
As of early 2026 (January data), growth continues but at a stable pace. Visitor numbers reached 1.99 million, up 2.8% year-on-year, indicating steady demand despite global uncertainties. - How is Dubai’s hotel industry performing?
Hotel performance is strong. The average daily rate reached $211.17 in early 2026, up 13.5%, while RevPAR increased to $182.02, showing that hotels are earning more per room while maintaining demand. - Are more hotels being added in Dubai?
Yes, supply is growing steadily. As of early 2026, Dubai has 647 hotels, up from 640 last year, and total rooms increased to 129,534, reflecting ongoing expansion. - Which regions bring the most tourists to Dubai?
Western Europe, CIS & Eastern Europe, and GCC countries remain the top contributors. However, growth is now stronger from regions like Eastern Europe, Africa, and the Americas, showing a more diversified tourist base. - Is Dubai still one of the busiest travel hubs globally?
Yes. Dubai International Airport handled 95.2 million passengers in 2025, making it one of the busiest international airports in the world and a key global transit hub.

I go the core of any topic and combine the best so that users don’t have to look elsewhere once they are on my blog.